


JavaScript has long dominated client-side web programming, but could a new Python framework shake things up? Yes. During PyCon US 2022, Anaconda’s CEO announced a new technology called PyScript that allows users to write Python code in the browser.
We only need to write and run Python code in HTML to build web applications. This means that we don’t need to worry about deployment, but everything will happen in our web browser.
One of the coolest and easiest things you can build on your web browser is Python visualizations.
This article will show how to display matplotlib visualizations on your web browser using PyScript.
Add PyScript to an HTML template
To set up PyScript, we need first a basic HTML template. Most text editors and IDEs have an HTML template you can work with. You only need to create an HTML file, then type either doc or HTML and hit enter.
<html>
<head>
<meta charset=”UTF-8″>
<meta name=”viewport”
content=”width=device-width, user-scalable=no, initial-scale=1.0, maximum-scale=1.0, minimum-scale=1.0″>
<meta http-equiv=”X-UA-Compatible” content=”ie=edge”>
<title>Document</title>
</head>
<body>
</body>
</html>
Now to use PyScript, import the style sheet and script from PyScript in the <head> section in the HTML template.
You should have something like this;
<html>
<head>
<meta charset=”UTF-8″>
<meta name=”viewport”
content=”width=device-width, user-scalable=no, initial-scale=1.0, maximum-scale=1.0, minimum-scale=1.0″>
<meta http-equiv=”X-UA-Compatible” content=”ie=edge”>
<title>Document</title>
<link rel=”stylesheet” href=”link-to-stylesheet” />
<script defer src=”link-to-script”></script>
</head>
<body>
</body>
</html>
You’ve successfully set up PyScript so far. Now you are ready to plot some visualizations on your web browser.
Matplotlib Plots On Your Web Browser with PyScript
The steps to plot a visualization with matplotlib and bokeh on a web browser are a bit different.
Start by making a line plot with matplotlib and showing it in the web browser.
Loading matplotlib
To make your line plot, first, you have to load matplotlib in the HTML file. You use the <py-env> tag for that in the snippet below.
<html>
<head>
<meta charset=”UTF-8″>
<meta name=”viewport”
content=”width=device-width, user-scalable=no, initial-scale=1.0, maximum-scale=1.0, minimum-scale=1.0″>
<meta http-equiv=”X-UA-Compatible” content=”ie=edge”>
<title>Document</title>
<link rel=”stylesheet” href=”link-to-stylesheet” />
<script defer src=”link-to-script”></script>
<py-env>
– matplotlib
</py-env>
</head>
<body>
<h1>Matplotlib</h1>
<py-script> print(“My Lineplot”)</py-script>
</body>
</html>
To see the results of this, you have to open this HTML file in your web browser. On Pycharm, you can easily do that by going to the upper-right corner and clicking on the Chrome icon.
Displaying a line plot on the web browser
Before you write Python code to create a line plot, in the <body> section you have to create a <div> that will contain the id of this plot. The id will be “lineplot”
<div id=”lineplot”></div>
Here’s the Python code to make the line plot;
# Python Code Goes Here …
import matplotlib.pyplot as plt
fig, ax = plt.subplots()
year_1 = [2016, 2017, 2018, 2019, 2020, 2021]
population_1 = [42, 43, 45, 47, 48, 50]
year_2 = [2016, 2017, 2018, 2019, 2020, 2021]
population_2 = [43, 43, 44, 44, 45, 45]
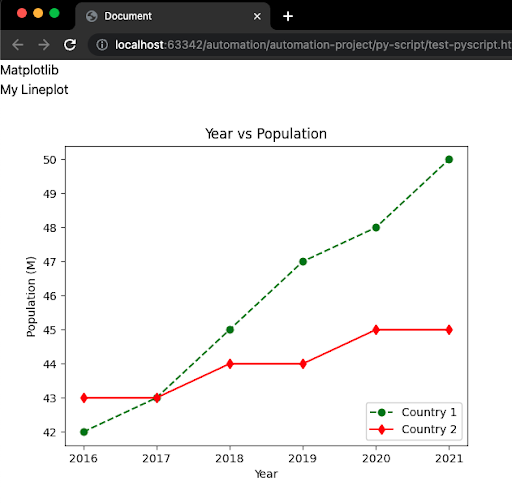
plt.plot(year_1, population_1, marker=’o’, linestyle=’–‘, color=’g’, label=’Country 1′)
plt.plot(year_2, population_2, marker=’d’, linestyle=’-‘, color=’r’, label=’Country 2′)
plt.xlabel(‘Year’)
plt.ylabel(‘Population (M)’)
plt.title(‘Year vs Population’)
plt.legend(loc=’lower right’)
fig
If you put all the elements together, you should see the line plot below in your browser (it might take a few seconds to load).
Conclusion
Now you know how to run visualizations on the web browser with Python and HTML.